Scopes, Breadboards, Sensors
Please Log In for full access to the web site.
Note that this link will take you to an external site (https://shimmer.mit.edu) to authenticate, and then you will be redirected back to this page.
We have a couple of goals for this lab. For one, we're hoping to help you become good friends with some of the lab equipment that we'll be using over the course of the whole semester. But we're also going to start exploring some interesting applications of circuits as sensors, which we'll explore more in future labs.
The lab also assumes you've watched the intro video to our oscilloscope, also in the prelab from pset 0. You should do that before you start this lab.
We have a help queue active for lab! Go through the lab, answer the questions on this page, and ask for checkoffs on the queue! When you're all done with everything, you're done! If you get stuck on the way, let us know; we're happy to help!
Remember that labs are a learning experience, not a test, so please ask us questions as you're working through!
Although we do want everyone to work individually and build their own circuits, it is also more than OK to ask friends/neighbors for help, too.
An oscilloscope can do many things and have many specific features, but it is essentially a device that records and then visually displays information about voltages for humans to understand. In most instances, the voltage is plotted as a function of time1. This functionality is extremely useful for analyzing and designing complicated electrical circuits. The usefulness of an oscilloscope comes down to two major problems that it solves for us:
- Humans can't inherently quantitatively assess most electrical phenomena. An oscilloscope captures electrical information and converts it to a visual format that is easy for a human to consume.
- Humans are comparatively slow creatures compared to most electronics. On our good days we can detect and process events that happen on the order of tens to hundreds of milliseconds in duration, whereas many modern electronics have events that take place over milli-, micro-, nano-, or even picoseconds. An oscilloscope can capture signals at a very high rate and then display snapshots of them that lets us, the humans, process and analyze them.
With these ideas in mind, let's look at our specific oscilloscope.
The 6.200 oscilloscopes come from Keysight (Thank you Keysight!) Do not abuse them. Take care of them. Treat them like you would treat your firstborn child or a cherished pet. Keysight makes good stuff so they're resilient, but still, respect these machines.
At first glance, the oscilloscope can be overwhelming. There's a screen and a whole lot of buttons with archaic names and words. Don't worry; most of them will start to make sense after using them for a while.
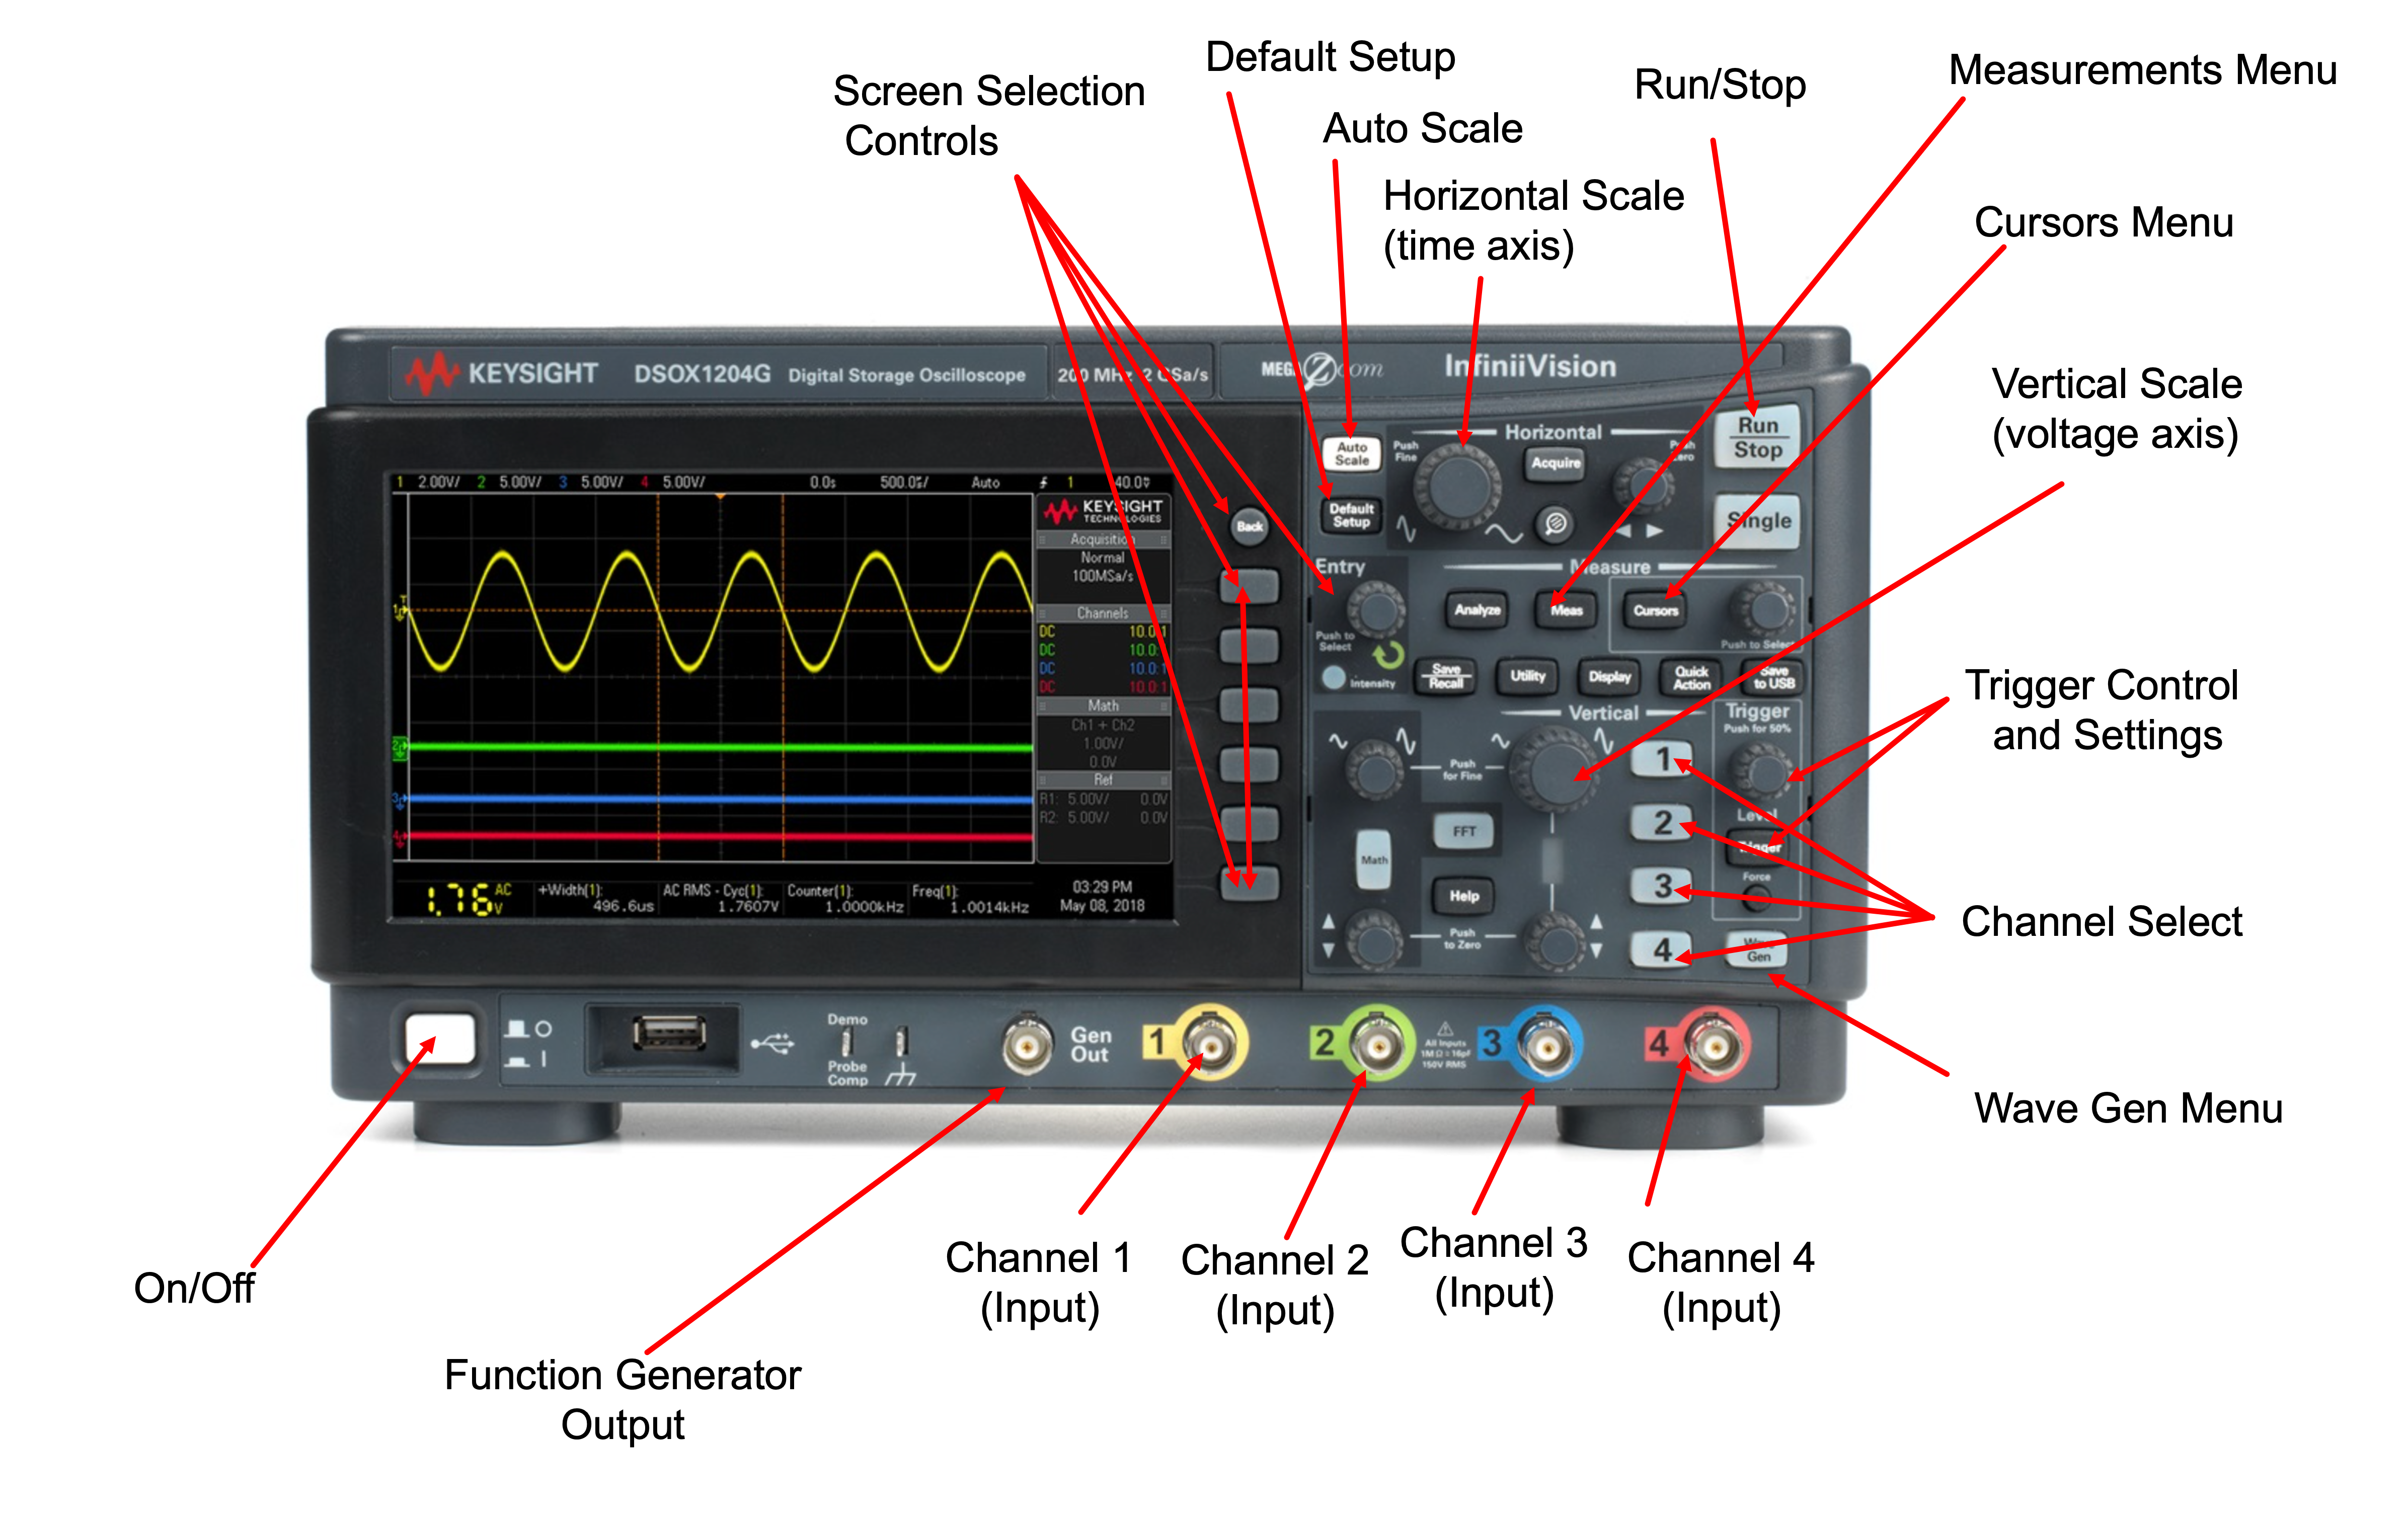
The first thing you'll notice is the screen where all information is displayed. Basic buttons you should know about:
- On/Off Button: You can turn on/off the oscilloscope with this. Powering the oscilloscope can take up to a minute, so be patient. If you want to turn the scope off, just push the power button again.
- Auto Scale: This is a good button to press when you don't know what else to do. Sometimes when manipulating all the controls, what you want to plot gets hidden due to some setting. Pressing Auto Scale prompts the scope to analyze all of its input and then using spectral and amplitude information about each channel decide the "best" settings for display. This may not be what you want and is not guaranteed to find the right signal/scale, but sometimes will get you sort of close. In other instances it won't, however.
- Default Setup: This will return the scope to a default/known mode (good to do after power up).
- Horizontal Scale: Allows you to zoom in or out in the time axis and adjust offets.
- Vertical Scale: Allow you to zoom in or out in the vertical (voltage) axis and adjust offsets.
- Run/Stop: Essentially a Play/Pause button.
- Screen Selection Controls: A series of buttons and a turny/clicky knob that allows you to select the appropriate settings for a given menu.
- Measurements Menu: Brings up the Measurements Menu.
- Cursors Menu: Brings up the Cursors Menu.
- Trigger Control and Settings: Brings up the Trigger Menu
- Channel Select: Brings up settings for each channel (also used to turn on/off individual channels)
- Function Generator Output: Our scope can generate reference and test signals and output them via this connector.
- Channels 1,2,3,4 Inputs: Signals get into the scope for measuring via the probes that are connected to these channels.
- Wave Gen Button (Menu): Brings up the Wave Generator menu
Go ahead and turn on the oscilloscope using the On/Off button. It will take
a little while, so be patient. After it has booted, press the Default Setup
button to place the scope back into a standard mode.
Please remember to put the scope in Default Setup.
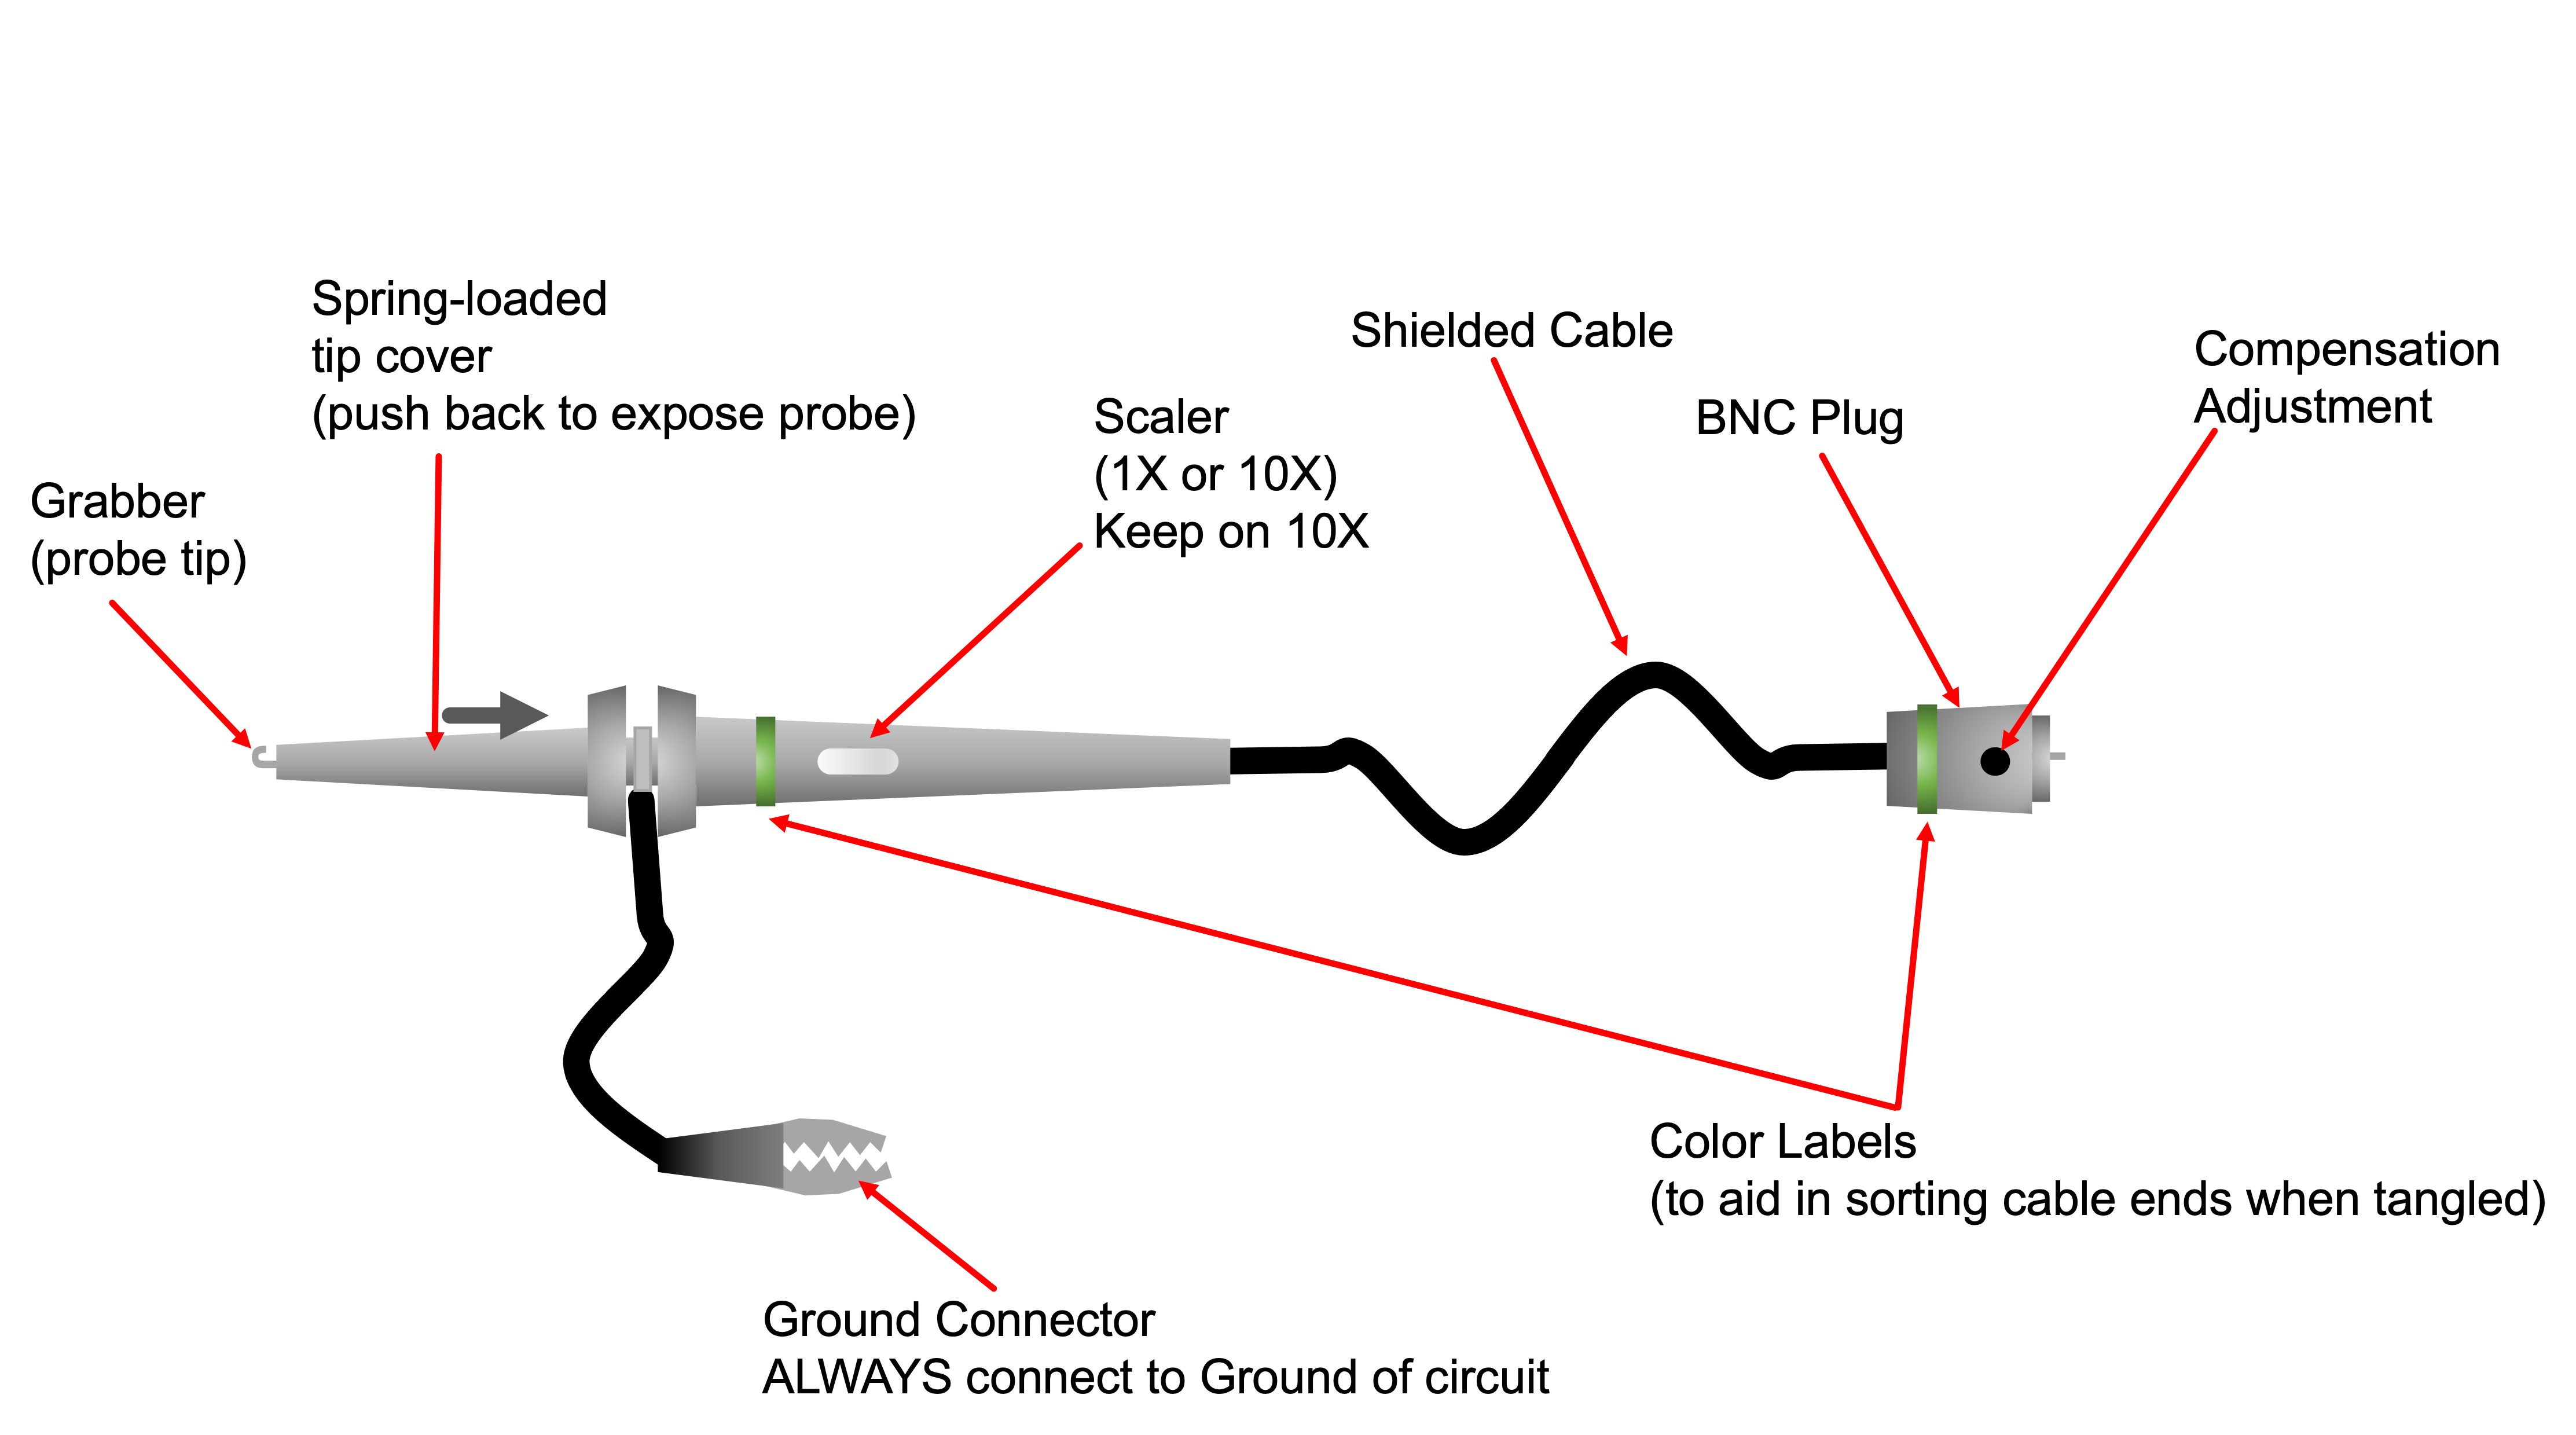
- The oscilloscope has four input channels on it. They are color-coded so you know which is which since the cables often get tangled.
- Special oscilloscope probes are used to connect to electrical signals and convey them into the oscilloscope channels.
- Each probe has two conductors, a ground conductor and the signal conductor, with both routed back to the oscilloscope.
- The central conductor is accessed by pushing back gently on the probe tip and connecting the grabby part to a wire or conductor of interest
- The ground connector is the small side alligator clip and must always be tied to the ground of the circuit in interest! You cannot put it at any arbitrary point in your circuit like you can with some other equipment. Ground must be connected to circuit ground!
- Never remove the ground clip from the oscilloscope probe, since it will inevitably get lost. There is a special place reserved in hell for people who remove ground clips from oscilloscope probes.
- There is a slider setting that can add a 10\times scaler or 1\times scaler on the signal (for very large signals). Always leave this slider on 10\times.
To get started, we're going to generate a signal using the Wave Generator menu which is sent out via a BNC-to-alligator clip cable. We will then read that signal back in to Channel 1 on our oscilloscope by bridging it together on the breadboard (you can get a breadboard from the cart in the far corner of the room, ask a staff member if you're having trouble finding it).
An electrical schematic of what we want to do is shown below:
In order to create this circuit bridge, we will use a breadboard. A breadboard is an electrical prototyping device that contains rows of springs intended for holding component leads. Particular groups of these springs are connected together underneath by conductors. As a result, the breadboard allows us to conveniently attach circuit components together and quickly generate circuits. The front and inside of a breadboard is shown below. Do NOT remove your breadboard back like we did below. We did it so you don't have to.
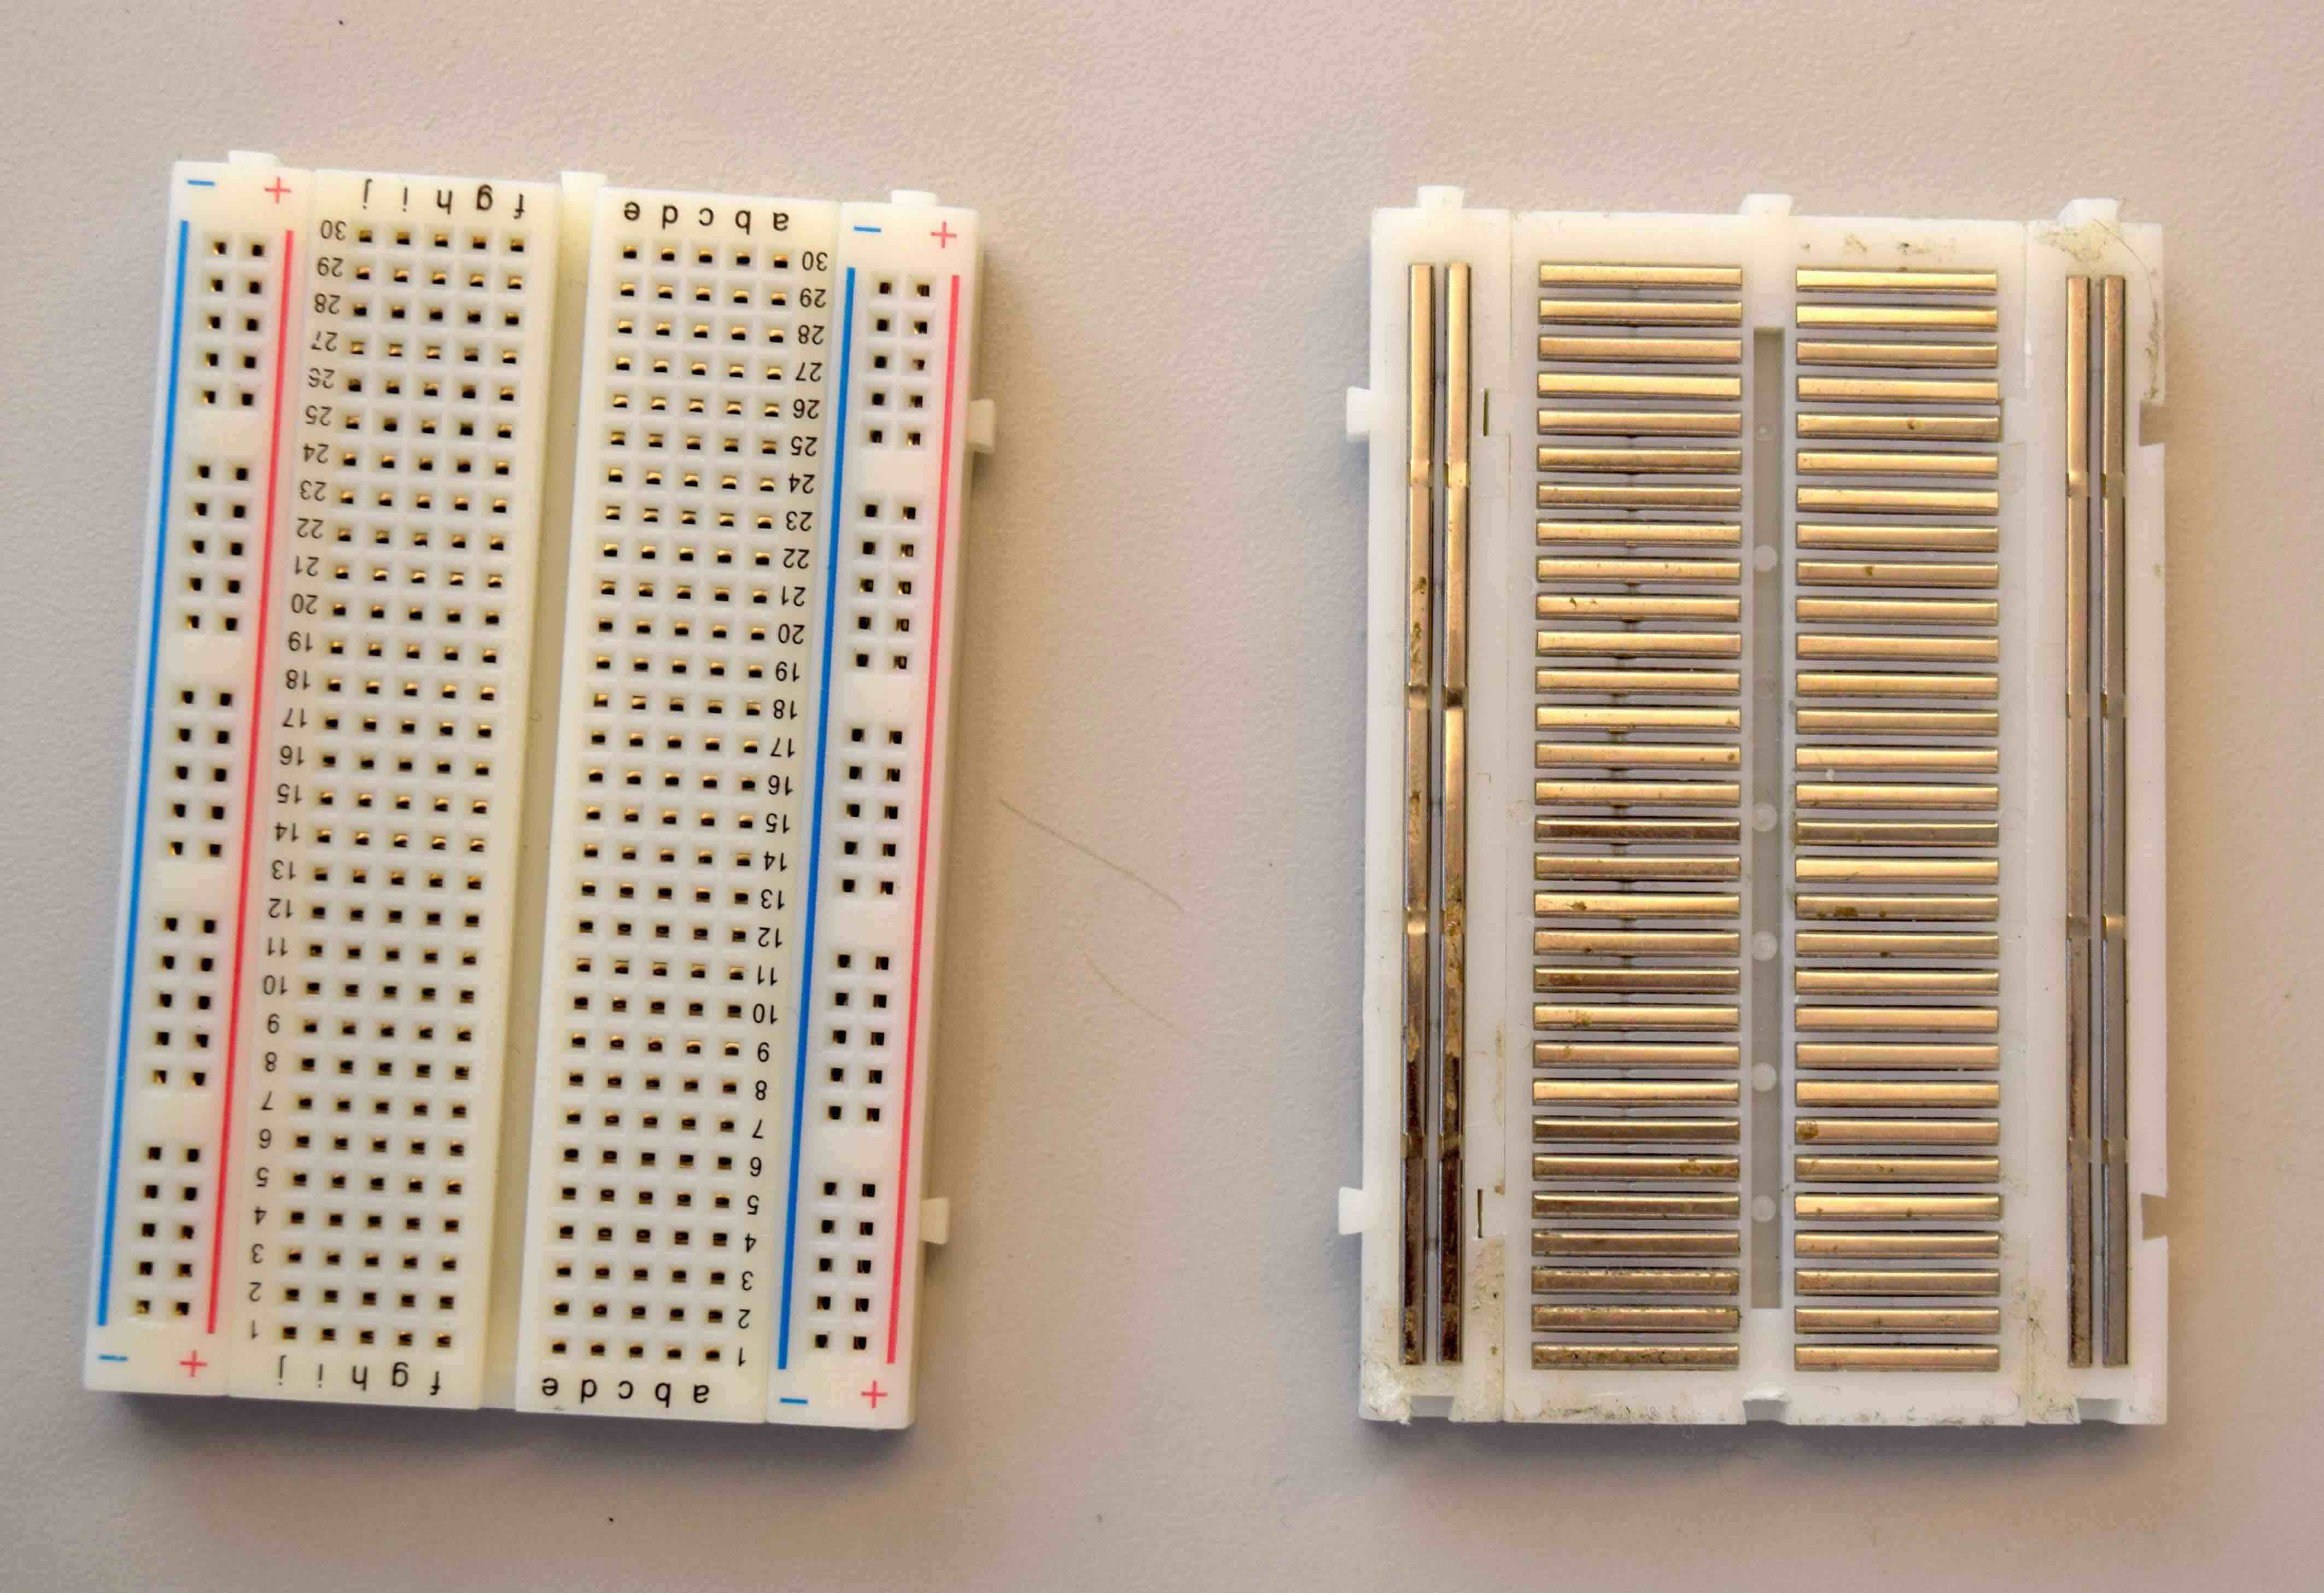
-
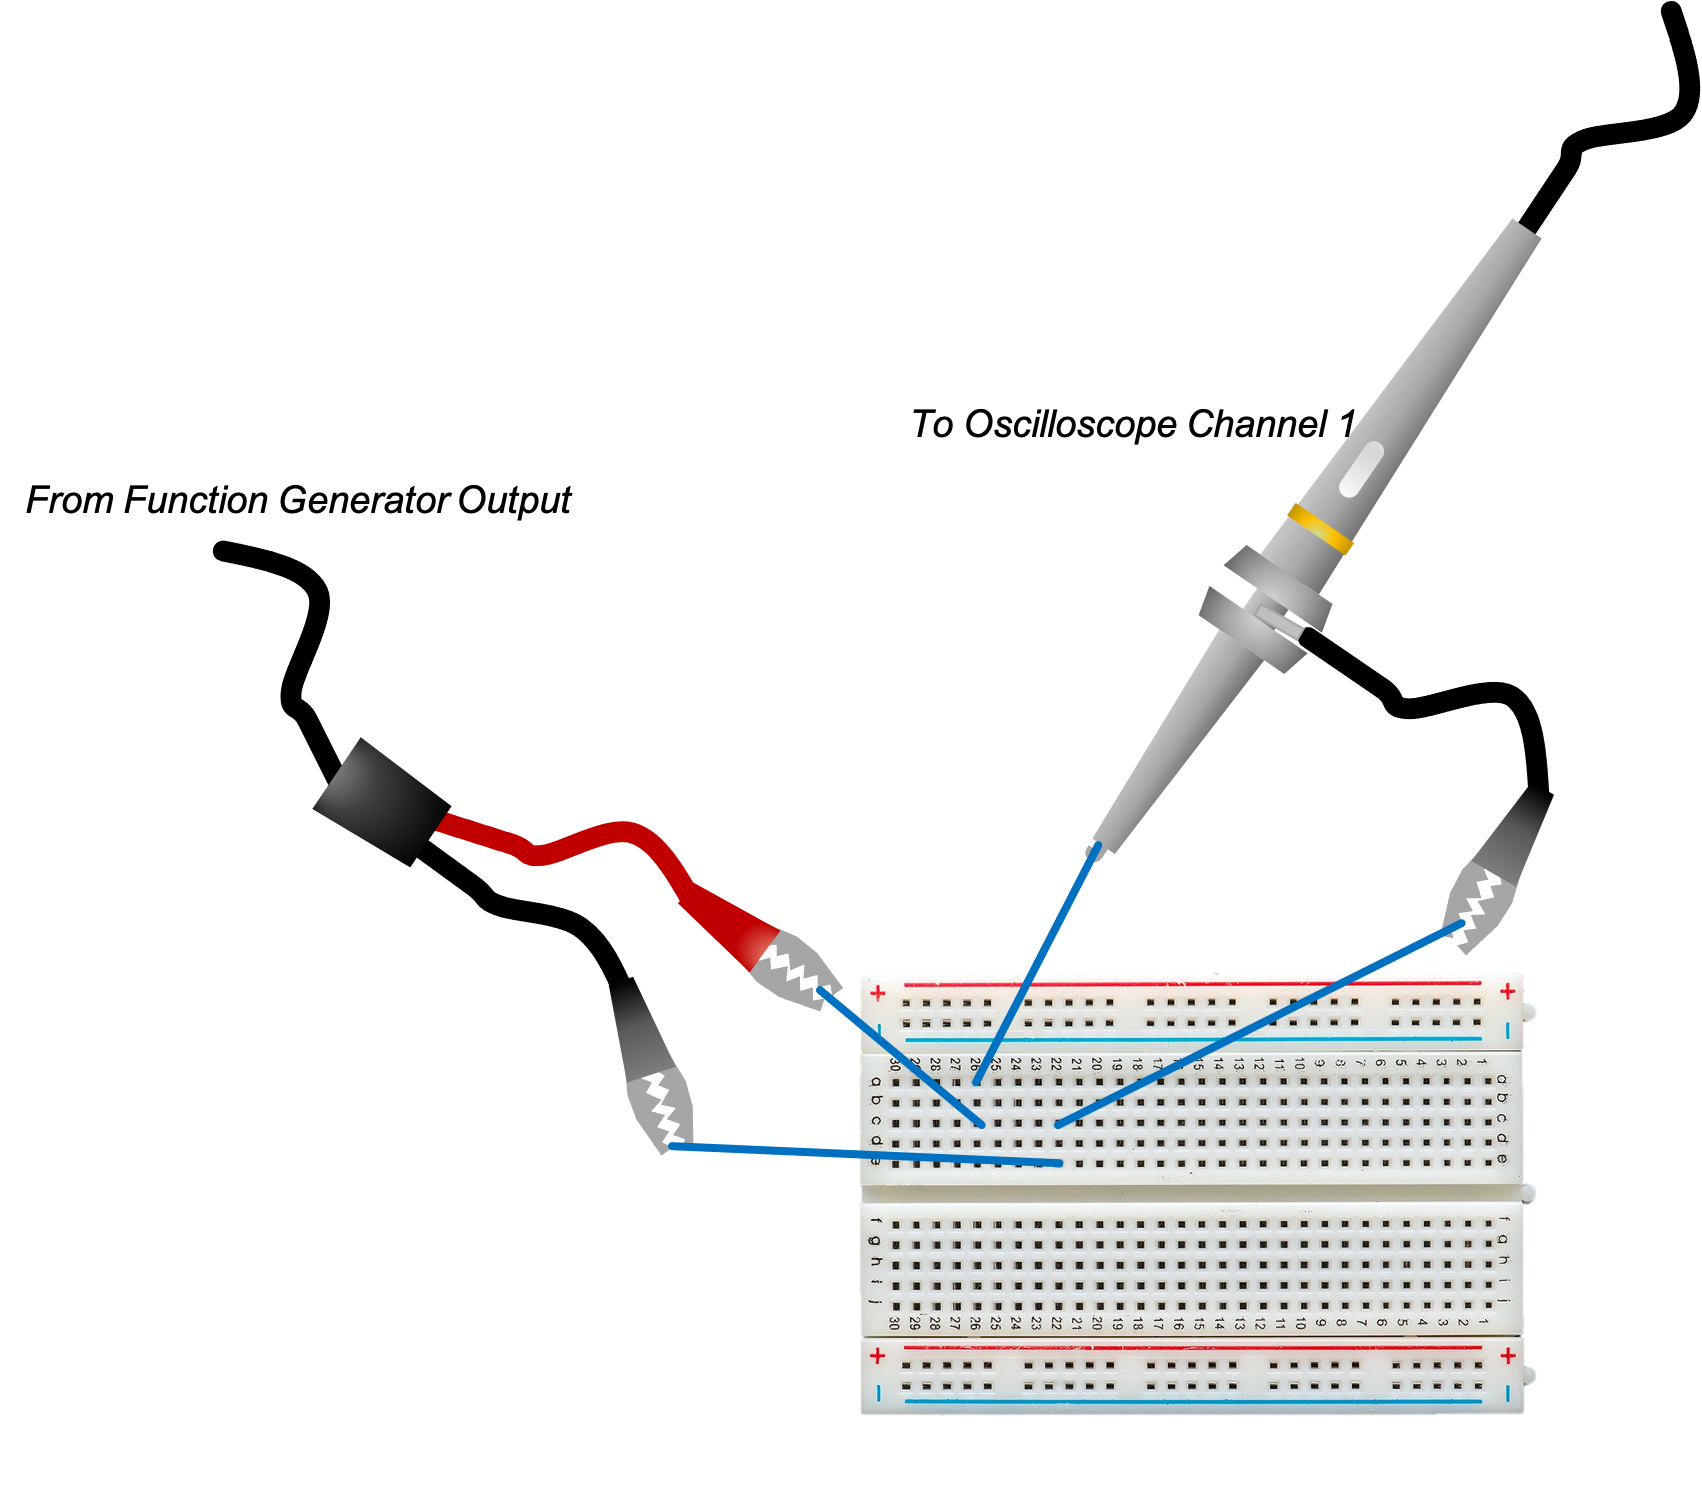
Since we're just getting started, a graphical image of what the signal bridge circuit would look like on a breadboard is shown below.
-
Grab/cut four small hookup wires. Use two of the wires to connect the two output wires to two electrical nodes in the breadboard. Wire strippers are on the cart in the corner! Wires are on spools on the other side of the lab!
The wire cutters/strippers look like this:

It has a sharp part (right near the hinge) that you can use to cut off a segment of wire. Then if you put the end of that wire into one of the holes near the top (the one labeled 24 AWG / 0.5mm is probably the right one), clamp down, and pull away, you can strip the plastic casing off the end of the wire
-
Use two more wires to connect the Channel 1 oscilloscope probe to the function generator output through the breadboard.
-
MAKE SURE THAT the "ground" (black) connection of from the function generator gets connected to the ground connection on the oscilloscope probe and the signal conductor from the function generator (red) gets connected to the actual signal conductor on the oscilloscope.
Once your circuit is complete, let's generate a signal.
The DSOX1204G scopes have an in-built function generator. This is an output that can generate various electrical signals which are often useful for probing the system being studied. Follow these steps to generate our first test signal:
- Turn on the waveform/function generator by pushing the
Wave Genbutton. This will bring up a menu. - Under this menu, click the "Settings" button (the bottom one on the screen), then click the "Default Wave Gen" button (the bottom one again) You should get a message on screen saying that things have been reset.
- Click the "Wave Gen" button again to go back to the menu where you can choose the form of the signal you're generating.
- Set the output signal to be a sine wave with:
- A 10 kHz frequency
- An amplitude of 1Vpp (1 Volt peak-to-peak)
- An offset of 0V
- On the oscilloscope, press the
Auto Scalebutton. Hopefully the oscilloscope should "find" the signal. If it doesn't, double check your wiring to make sure you're connecting things correctly. Otherwise, ask a staff member for help!
Click the Channel 1 button and then using the appropriate option key, turn BW
Limit to be on. This will cut down some high frequency artifacts that are
potentially confusing the scope.
Feel free to play around with the controls (adjusting frequency, amplitude, and offset and seeing how the wave changes), but before moving on to the next part, set them back to a 10kHz sine wave with 1V peak-to-peak and 0V offset.
Once you've created the appropriate signals, feel free to use the horizontal and vertical axis controls to adjust the scaling of what gets rendered. Zoom in and zoom out to your heart's desire. The dimensions of the plot are shown in the top left (for the y axis) and the top-right (for the t axis).
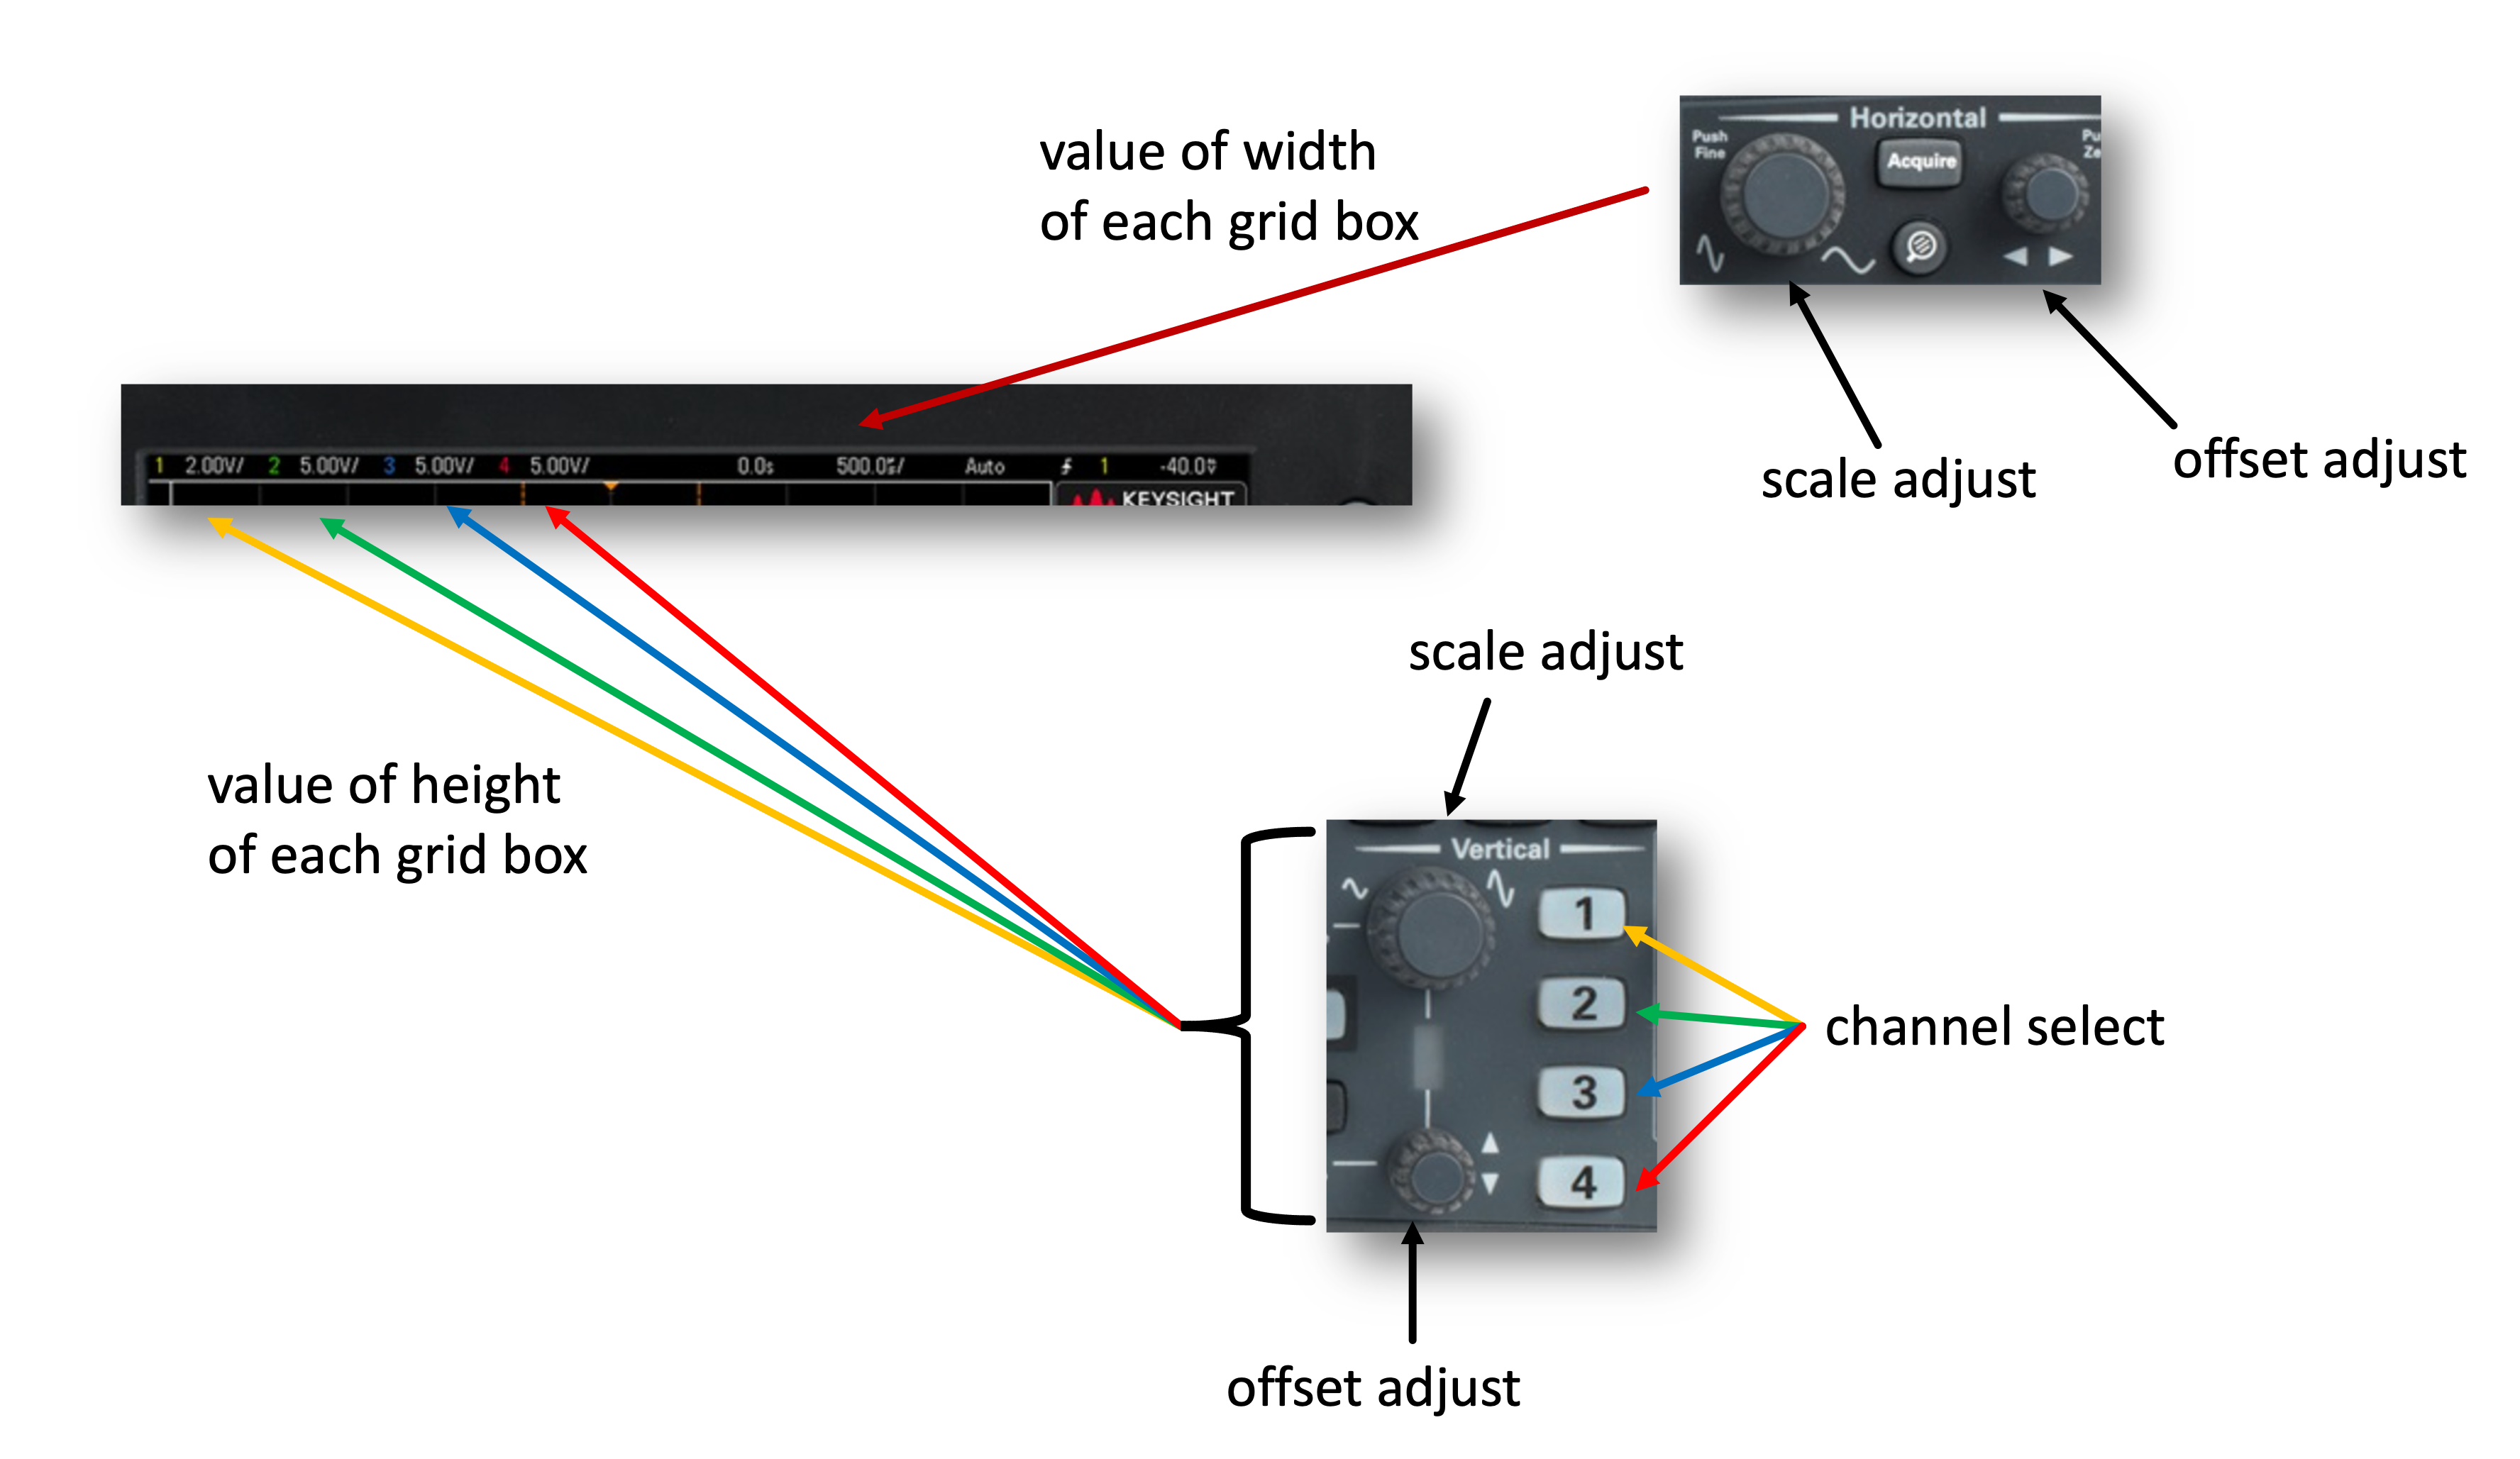
The signal we generated in the previous section was created by us and we're measuring it directly so we sort of already know what its quantitative attributes are. But what if we didn't? How could we determine stuff about the signal. This is where the oscilloscope's measurement abilities come into play. Try forcing the scope to measure for you, and also try using the cursors.
What we'd now like to do is generate a second signal to measure (in addition to our first signal). We're going to create a simple voltage divider shown schematically below. Grab the two resistors from the resistor tray in lab (near the large wire spools) and build the circuit below using your breadboard (ask for help if needed!). When complete, attach probe 2 to the electrical node in between the 11 \text{k}\Omega and 22 \text{k}\Omega resistors.
We've labeled the drawers in the resistor cabinet with their values, but each resistor also has colored bands on it indicating the value of the resistance in question. Here is a nice diagram showing what the different bands and colors mean. In this color scheme, the 11k\Omega resistor will have a stripe pattern of brown-brown-orange (1-1-3, meaning 11\times 10^3\Omega). The gold band on the end indicates that this resistor is accurate to within 5% of that value (it won't be perfectly 11k\Omega). The 22k\Omega resistor has bands like red-red-orange (2-2-3, meaning 22\times 10^3\Omega).
Using a combination of auto-measurements and cursors determine:
- The maximum voltage of the sinusoidal waveform on Channel 2, V_{max}
- The minimum voltage of the sinusoidal waveform on Channel 2, V_{min}
- The peak-to-peak amplitude of the sinusoidal waveform on Channel 2, V_{pp}
- The frequency of the sinusoidal waveform on Channel 2, f_{ch2}
Compare these measurements to what you see on Channel 1. Do these results make sense? How do they compare to the theoretical result from solving the circuit? What are some general conclusions that can be made?
Talk with a staff member and answer the following questions: Also be prepared to demonstrate and/or discuss the following:
One powerful feature of many kinds of circuit components is their ability to sense things that humans are not capable of sensing; and oscilloscopes give us a way to visualize things that we couldn't sense on our own.

In the remainder of the lab, we'll experiment with a couple of devices whose parameters vary based on their physical environment. These kinds of components give us a means of transduction, of converting information from the physical world (about light, temperature, sound, force, etc) into electrical signals, which can then be visualized (or acted on) by other devices.
The first new component we'll look at today is called a photoresistor. This is a special kind of resistor whose resistance depends on the amount of light falling on it.
The physical device (shown on the right below) has two terminals just like a regular resistor, but its shape is different and it has a squiggly line on it. Schematically, we will represent photoresistors using the glyph shown on the left below (a resistor with two little arrows pointing at it representing light).
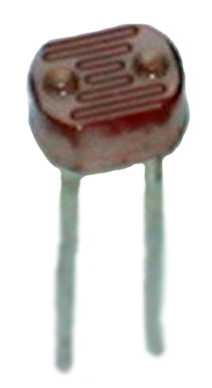
We're going to use this component to build a little circuit to help us detect light. But before we do that, let's get to know this component a little better. In particular, let's start by measuring its resistance. Unfortunately, the oscilloscopes don't give us a way to measure resistance directly, but we do have a different device that will allow us to make that measurement directly: a multimeter which also sets on the bench, shown below:
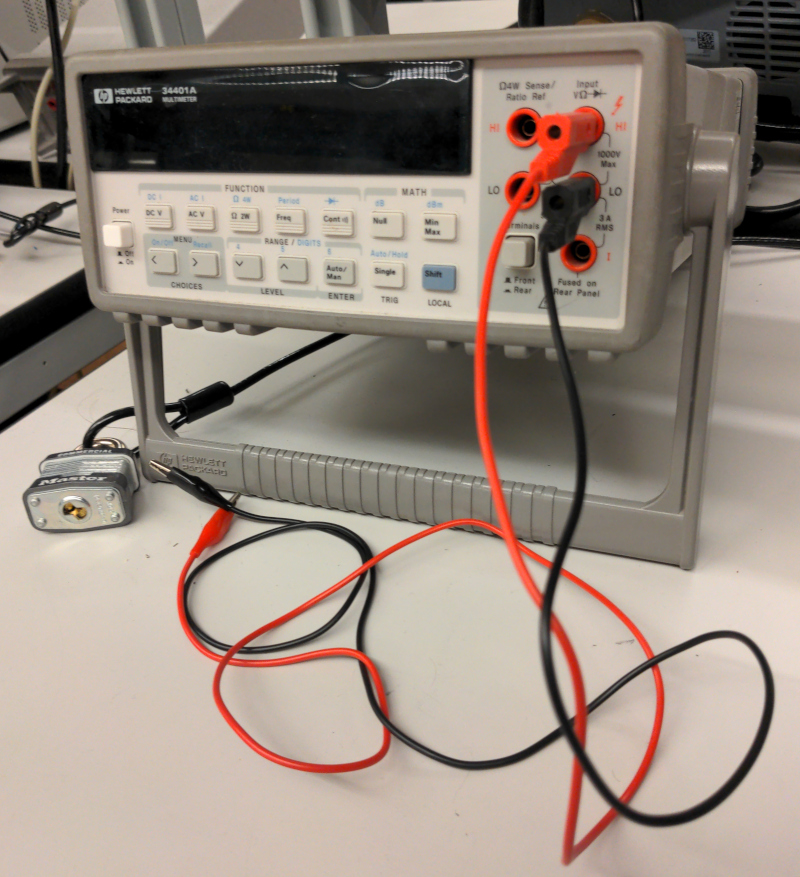
Turn on the multimeter and then hit the button labeled \Omega (for Ohms), which will set it up to measure resistance, and grab a photoresistor from the cart near the front of the room. If you clip the red clip from the multimeter to one terminal of your photoresistor and the black clip to the other, you should start seeing resistance values come up on screen. Let us know if you're having any trouble.
Once you have those connected up, you should see measurements start appearing. That measurement contains not only a number, but also units. Pay close attention to the units! For example, in the image below, the big "M" indicates that we're seeing a value in megaOhms. If that were a "k" instead, that would mean kiloOhms, and if it's empty, we're just seeing Ohms, and so on.
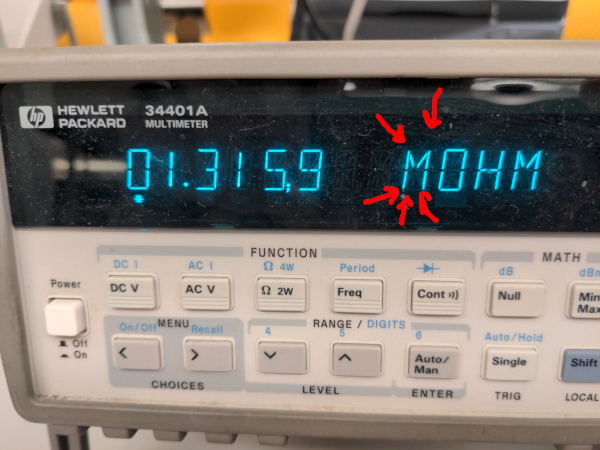
Meter showing a measurement of about 1.31M\Omega
Answer the following questions, and be prepared to discuss during your checkoff:
- What is the resistance when in ambient lighting?
- What is the resistance if you cover the end of the photoresistor with your hand, blocking the light? (be careful not to let the leads touch each other!)
- What is the resistance if you shine a bright light on the photoresistor from close by?
Write those down.
Feel free to ask a staff member for help if you're unsure of the values you're seeing.
With those values in mind, let's build another circuit to create a voltage that depends on the brightness of the lights in the room. Take a look at the circuit below. Before building it, predict: as the amount of light goes up, will the voltage indicated below go up, down, or stay the same?
Now, grab yourself a new 1k\Omega resistor from the cabinet (brown-black-red for 1-0-2, 10\times 10^2\Omega) and lay the circuit out on your board, setting up the wave generator on the scope to create a constant ("DC") value of 10 Volts by changing the Wave Gen "Waveform" selector to "DC" and the "Offset" to 10V.
We'll start by using the multimeter (not the scope yet) to measure the voltage. With your multimeter on, click the "DC V" button to measure a voltage, and then connect the alligator clips from the multimeter to the spots indicated in the drawing above (the red clip from the multimeter should go to the spot labeled CH1+ on the drawing above and the black clip should go to the spot labeled CH-). What is the voltage drop there, and how does it change as you shade the photoresistor or shine a light on it?
Now let's hook it up to the scope instead. Disconnect the multimeter probes (you can also turn off the multimeter now, it's done its job for the day) and replace them with your scope probes. Click the "Default Setup" button, then click the channel 1 button and make sure the "BW Limit" is turned on.
Try shading the photoresistor and shining a light on it again. How does the display change as you do that? Does this make sense given what you saw on the microscope?
Probably, what you just saw looked like a straight line (representing a more-or-less constant voltage) that moved up and down as you varied the lighting conditions. But it turns out that there is also something else going on there! We can't really see it, but the scope is going to help us out.
Mostly what we're measuring here (unless you're shining your own light on the photoresistor) is light from the overhead fluorescent lights. To human eyes, this looks like it's constant; but it turns out that it's actually changing slightly (and not at random, but in a very regular and predictable way).
This is one place where circuits (and the scope) really shine. What we're going to do is take this (likely inperceptible) change in lighting conditions and turn it into an electrical signal, which the scope can help us visualize.
What that change in lighting conditions means for our circuit is that there will be a small oscillatory voltage added on top of the constant-looking voltage we were seeing before.
To find this signal, let's do the following:
-
Firstly, the offset in the signal can change pretty dramatically as we're moving around, casting shadows, etc. We can make the scope ignore that and show us only the oscillatory parts of our signal by clicking the channel 1 button and changing "Coupling" (the top option) to "AC" instead of "DC". This will cause the scope to show only the oscillatory parts of our signal.
When you make this change, you should see the line jump down to 0 on the display.
-
Now, let's zoom in. Zoom in to around 5 milliVolts per div in the vertical dimension and 5 milliseconds per div in the horizontal dimension. You should start to see something that looks like a sine wave.
Use the measurement tools and/or the cursors here. What is the frequency of this oscillation?
Note again that this is not an artificial signal at all; what we're seeing there is really a measure of the tiny, almost-imperceptible flickering of the lights in the room
!
Let's move on now to our last experiment of the day, which will involve a different sensor and give us a way to explore another feature of the scopes.
Sometimes we're interested in observing events that are very "rare," which could mean that the aspect of a signal that we care about is very small relative to the signal's period, for example, the narrow pulse from the prelab video. In that video, every 10 seconds, a brief 50 \mu s pulse appeared. Since the part of the signal (the pulse itself) is only 0.0005% of the signal, the scope will do a capture, but by default, even with a proper trigger if nothing gets triggered after a certain amount of time, the scope will "force" a trigger, meaning it will continue drawing based on periodic samples. The result is the pulse may briefly appear but quickly be hidden by other aspects of the signal.
In order to fix this, we can change the mode of the trigger from "Auto" to "Normal". The two different modes operate as such:
- Auto: The oscilloscope will capture and render when the trigger event happens, but if after a certain period of time no new trigger events happen, the trigger will be "forced", meaning it will make another capture/render based on samples periodic in time
- Normal: The oscilloscope will ONLY capture and render when the trigger event happens. The trigger will never be forced.
To change the mode, press the Trigger button and change the mode to Normal
in the menu that comes up. Placing the scope into Normal trigger mode means we
can let the system run and know that when a trigger event happens, the scope
will trigger and render it, but not force itself to start drawing stuff we
don't care about!

In order to demonstrate this, let's try using another cool circuit element whose properties change based on the physical environment in which it is placed: a microphone! The picture below shows the microphone we'll be using in today's lab from a couple of different angles. Note that it also has two terminals.
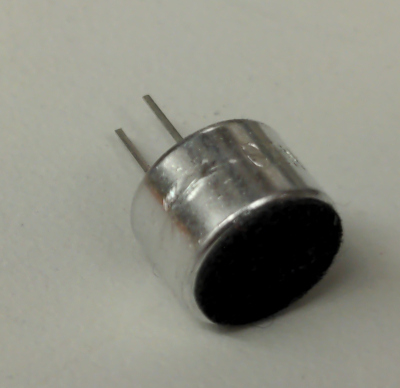
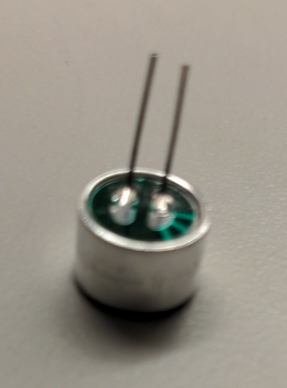
When connected in a particular configuration (like we'll do in just a second), this microphone will behave like a current source, setting its current to be some value proportional to the instantaneous air pressure (so that sound waves entering the microphone cause relatively strong, oscillating values of current).
Unlike the resistors and photoresistor we saw before, this device has a polarity. It is important that the lead with the three lighter-green lines on it is connected to ground in the topology below.
Before building the circuit, set the wave gen output to be a constant ("DC") 5 volts, and click the "Default Setup" button on the scope.
Did you do it? It's not at 10 Volts anymore, right? And you clicked "Default Setup"?
Good.
Now, for our last circuit of the day. Leave your photoresistor circuit in place (we'll need it during the checkoff), and build the following circuit on a different portion of the board. Note that the current source drawn below represents the microphone (and the current through it will change as we make sounds).
Do this without grabbing a 33k\Omega resistor from the cabinet. How can you make something that behaves like a 33k\Omega resistor using the components you already have from earlier in the lab?
You may need to zoom in a bit using the scope, but once you've zoomed around properly, you should be able to see a noticeable change if you snap your fingers or clap your hands right next to the microphone. Make sure that you've got "BW Limit" set on the channel you're using to measure; otherwise it can be hard to see.
Use the triggers to "freeze" on one of those events by putting the trigger in Normal mode, setting it appropriately, and snapping/clapping. You should see a small blip stay put on the screen (until you do it again, at which point the graph should change). Again, no worries if you get stuck; we're happy to help!
You may also wish to try speaking or whistling or something like that and observing how the signal changes. It's kind of neat to whistle at a couple of different pitches and see the signal change. But mostly be prepared to discuss the clapping/triggering example during checkoff.
Discuss the oscillscope and triggering with a staff member. Be prepared to do/answer the following questions: Be prepared to show the staff member your signal you measured. After your checkoff, clean up by: