Frequency Response
Please Log In for full access to the web site.
Note that this link will take you to an external site (https://shimmer.mit.edu) to authenticate, and then you will be redirected back to this page.
In lab today we're going to get some more practice with analyzing our circuits using the impedance method and interpreting the results of that analysis. We will use today's lab to get some hands-on experience with the ideas from the past couple of week's lectures (impedance and frequency response).
In particular, we're hoping that you'll come away from this lab with some practical experience with the skills we've been developing in class:
- reading and understanding a Bode (gain vs. frequency) plot
- understanding how the frequency-domain (Bode) plot contains information about time-domain plots
- converting between dB and gain
- using theory to design a filter to remove undesireable parts of a signal
1) Theory Warm-Up
We're going to start today by considering a familiar circuit:

Today we'll be doing a bunch of frequency analysis on circuits like these, but let's start by working out some theory. Answer the questions below to get started.
Enter your answer as a Python expression below.

Enter your answer as a Python expression, using omega for \omega, j for j, R for R, and C for C.
HINT: Using the impedance method lets us treat this like a voltage divider!
Enter your answer as a Python expression, using omega for \omega, j for j, and tau for \tau.
HINT: Using the impedance method lets us treat this like a voltage divider!
Enter your answer in terms of tau (\tau).
Enter your answer as a symbolic expression in terms of tau (\tau) and pi (\pi).
2) Getting Started
Before building, let's reset the scope to all of its defaults by:
- Pushing the "Default Setup" button in the upper left, and
- Under the "Wave Gen" menu (accessible by pushing the button in the bottom right), click the "Settings" button (the bottom one on the screen), then click the "Default Wave Gen" button (the bottom one again) You should get a message on screen saying that things have been reset.
3) Really Getting Started
Get out your breadboard and get a few short wires. Grab a 3{\rm k}\Omega resistor and a 0.1{\rm \mu F} capacitor and build the circuit below:

The waveform generator from our scope will serve as V_{\rm sig} here, and we'll measure v_{in} using Channel 1 and v_{out} with Channel 2. Set up the wave generator with the following settings:
- Sine Wave
- 10 Hz
- 1Vpp
- 0V offset
While watching the amplitudes of the two signals, gradually increase the frequency of the sine wave up to maybe 100 kHz. Note you will need to periodically zoom in on the horizontal scale in order to keep being able to see the signal.
Now, set the frequency to be this -3dB point you found earlier, and zoom things so you can clearly see channel 1 and channel 2 compared against each other. Measure the ratio of the amplitudes and eyeball the phase difference and make sure that they match your expected results from theory land.
Take a photo of this measurement (including both channel 1 and channel 2) that clearly shows the amplitude ratio and phase offset and their associated labels! You will need both the photo and the measurements/results during checkoffs or later analysis.
4) Frequency Response
We would like to be able to characterize circuits' behaviors at a wide variety of frequencies (not just one). Given what we currently know, that would require us taking a whole bunch of measurements, changing the frequency of the wave gen manually, reading off some values, and then plotting them out like a chump. Thankfully our friendly neighborhood scopes give us a better way to characterize the behavior of the circuits, a "frequency response analysis".
4.1) An Example Frequency Response
The plots that come from the frequency response analysis (Bode plots) were discussed in lecture, and we'll use this lab as an opportunity to deepen our understanding of what these plots mean. Before you do a frequency sweep, let's give a preview of what you'll eventually get. Consider the example frequency response curve below (for a different circuit than the one above):
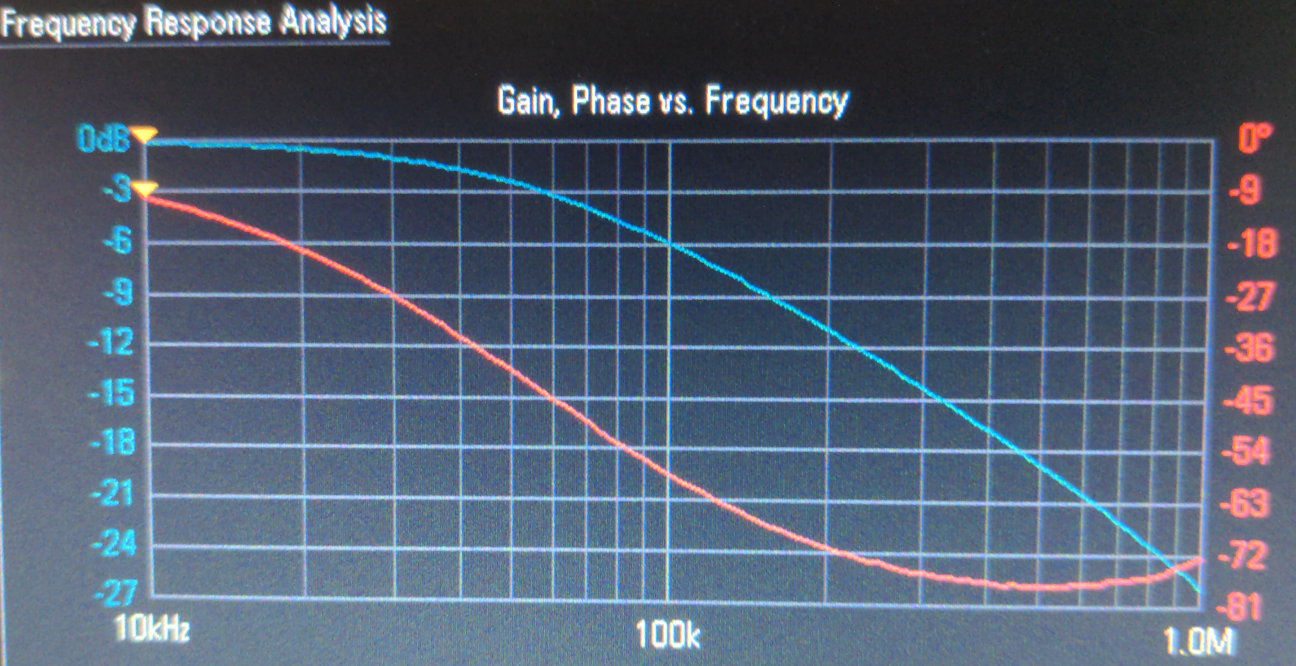
Using the example plot above, answer the following questions:
4.2) On Your Circuit
Now that we've gotten some practice with reading a Bode plot, let's go ahead and generate one. We'll use the same circuit from before, but with different values than the ones used in the graph above:
With your circuit still the same and all your connections the same as before,
go to Analyze >Features>Frequency Response Analysis. This should bring up
a plot.
Then go to Setup and set:
Start Frequencyat 10 HzStop Frequencyat 100 kHzAmplitudeat 1VppPointsat 120 (the number of frequencies to analyze)
Then, click "back" to get back to the main FRA menu and then click "run analysis". The screen will flash a bunch of sine waves as it sweeps 120 frequency points and analyzes the output over input ratio. When completed (after ~30 seconds), it'll give us a frequency response similar to what's shown above. The blue shows a plot of the magnitude (in dB) of \frac{v_{out}}{v_{in}} over frequency and the red is a plot of the phase (in degrees) of \frac{v_{out}}{v_{in}}. This should look very familiar based on the lectures this past week.
Using the "Entry" knob, identify what the -3dB point of your circuit is. Does it line up with your prediction from theory? Make sure it does! If not, ask for help!
Take a photo of your circuit's frequency response, with the -3dB point clearly visible! You will need it during checkoffs or later analysis.
5) The Ol' Switcheroo
Now let's make a little change and see what happens. In particular, let's swap the resistor and the capacitor like so:

omega" for \omega and "j" for j and numbers for everything else.
Run an identical sweep on this circuit using the settings you previously used. Study the result and what do you see?
Take a photo of your circuit's frequency response! You will need it during checkoffs or later analysis.
Discuss what you've seen so far in lab. Be prepared to discuss the frequency responses of all your circuits including showing snapshots.
6) Loop-de-loop
Alright, we've tested a capacitive circuit. Now let's try an inductor. Consider the RL circuit below:

omega, L, R, and j..
R =~
Go ahead and grab one of those inductors (they're just a super-cute little pre-packaged coil of wire), as well as the closest resistor you can find to the value you wanted (we won't have exactly that value, but there should be something close), and use that to lay out this circuit on your board.
Make sure to use your new resistor value Then let's go ahead and run a frequency response on this one, using the same settings from before (what do you expect the output to look like, compared to the first frequency response we ran in this lab?):
Start Frequencyat 10 HzStop Frequencyat 100 kHzAmplitudeat 1VppPointsat 120
Press Run Analysis and study your frequency response!
Take a photo of your circuit's frequency response! You will need it during checkoffs or later analysis.
What are the most noticeable differences from what the theory predicts the graph should
look like?
Unfortunately, this is a limitation of the components we're using. That "inductor" we grabbed from the front of the room isn't actually a pure inductor ඞ; rather, we can think about it as an ideal inductor in series with a resistance (that comes from the long coil of wire making up the little inductor package):

How does this resistance explain (both qualitatively and quantitatively) the differences between the frequency response you expected and what you measured?
Discuss the results of your experiments with the RL circuit. Be prepared to answer/discuss the following:
7) Second Order Filters
Alright, now let's try adding both an inductor and capacitor to the same filter. Build the following circuit, grabbing a new 120 \Omega resistor.

omega, L, R, C, and j.
L, R, and C.
Then let's go ahead and run a frequency response on this one, using the same settings from before (what do you expect the output to look like, compared to the first frequency response we ran in this lab?):
Start Frequencyat 10 HzStop Frequencyat 100 kHzAmplitudeat 1VppPointsat 120
Press Run Analysis and study your frequency response!
Take a photo of your circuit's frequency response! You will need it during the checkoff.
What is the specific value of the magnitude at that point? Given that, is this RLC
circuit underdamped, overdamped, or critically-damped?
Discuss the results of your second order filter with a staff member.
What changes in a second order filter? What is the slope of the gain? Where is the cross over frequency?